About
For the first time in a federal survey, the government's National Survey on Drug Use decided to ask the people about all uses of prescription medicines, not just inappropriate use. The survey found that 119 million Americans age 12 and over took prescription psychotherapeutic drugs (used to treat psychosis-affects mood and behavior) over the span of a year. That's 45 percent of the United States population. It's clear prescription drug use has become more prevalent than ever – with nearly half of the American population taking at least one prescription. Do American doctors overprescribe? Are we a culture that's too fast to look for pharmaceutical fixes? There is an overwhelming amount of data that points to drug epidemics in various age groups as signs of a pill popping culture, for example: the overprescribing of ADHD and antipsychotic drugs to children, the painkiller and sleeping pill abuse epidemics, and the largely unchecked polypharmacy among the elderly, who many doctors see as cash cows. For this project, i'm focusing on the three main classes of psychotherapeutic medication most commonly misused (with sedatives and tranquilizers being in the same class):

Opioids or Painkillers
Generally referred to as painkillers, these drugs contain opium or opium-like substances and are used to relieve pain. Before the opium poppy was utilized in medicine, it was used in food and ritualistic acts dating as far back as the Neolithic age.

Central Nervous System (CNS) Depressants
These drugs slow brain function. This includes tranquilizers, sedatives, and hypnotics. Sedatives are used to make a person calm and drowsy and tranquilizers are intended to reduce tension or anxiety. Hypnotics are typically used to treat sleep disorders.

Stimulants
A class of drugs intended to increase energy and alertness but which also increase blood pressure, heart rate and breathing. Most often prescribed to treat attention-deficit hyperactivity disorder with medicines like- Adderall, Ritalin, Vyvanse, etc.
Prescription Drug Misuse (PDM)
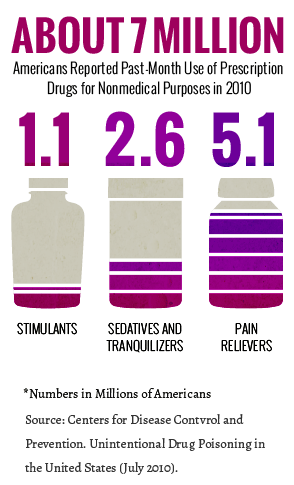
Of the 119.0 million Americans aged 12 or older using prescription psychotherapeutic drugs in the past year, representing 44.5 percent of the population (NSDUH Federal Survey): 97.5 million people used pain relievers (36.4 percent), 39.3 million used tranquilizers (14.7 percent), 18.6 million used sedatives (6.9 percent), and 17.2 million used stimulants (6.4 percent).
million used pain relievers
million used tranquilizers
million used sedatives
million used stimulants
.
From the same Federal survey, 18.9 million people aged 12 or older (7.1 percent) misused prescription psychotherapeutic drugs in the past year. From this number: 12.5 million people misused pain relievers in the past year (4.7 percent), 6.1 million misused tranquilizers (2.3 percent), 5.3 million misused stimulants (2.0 percent), and 1.5 million misused sedatives (0.6 percent).
Misuse of prescription psychotherapeutic drugs is the nation's second most prevalent illicit drug use issue (marijuana being the first). The National Survey on Drug Use and Health (NSDUH) questionnaire was redesigned regarding the data collection regarding four categories of prescription psychotherapeutic drugs: For the first time, NSDUH respondents were asked to report about any past year use of prescription drugs, which includes the use of one's own prescription medication as directed by a doctor, as well as misuse. In addition, misuse was redefined in 2015 as use in any way not directed by a doctor, including use without a prescription of one's own; use in greater amounts, more often, or longer than told to take a drug; or use in any other way not directed by a doctor.
The first drop down includes the overall number of psychotherapeutic drug users from the past year vs the overall number of non psychotherapeutic drug users from the past year. (12 years of age and older) The second drop down includes the overall number of psychotherapeutic drug MISusers from the past year vs the overall number of non psychotherapeutic drug MISusers from the past year. (12 years of age and older)
The four categories of prescription drugs (pain relievers, tranquilizers, stimulants, and sedatives) cover numerous medications that currently are or have been available by prescription. NSDUH reports and tables combine these four prescription drug categories into a group referred to as "psychotherapeutics." Prescription pain relievers include opioids (and opioid-like substances if specified) such as hydrocodone (e.g., Vicodin®), oxycodone (e.g., OxyContin® and Percocet®), and morphine. Prescription tranquilizers are often prescribed for anxiety relief or to relieve muscle spasms. These include benzodiazepine drugs such as alprazolam (e.g., Xanax®), muscle relaxants such as Soma®, and other prescription tranquilizers. Prescription stimulants are often prescribed for the treatment of attention-deficit hyperactivity disorder (ADHD) or obesity. For example, amphetamines (e.g., Adderall®) and methylphenidate (e.g., Ritalin®) are prescribed for ADHD. Although originally developed as a prescription stimulant, methamphetamine is no longer asked about in NSDUH as a prescription stimulant because it tends to be illegally manufactured and distributed. Prescription sedatives are often prescribed for the relief of sleep disorders such as insomnia. Zolpidem (e.g., Ambien®) is an example of a prescription sedative.
Data bar: Drug overdose death rates, by sex: United States, 2015 (in thousands)
.
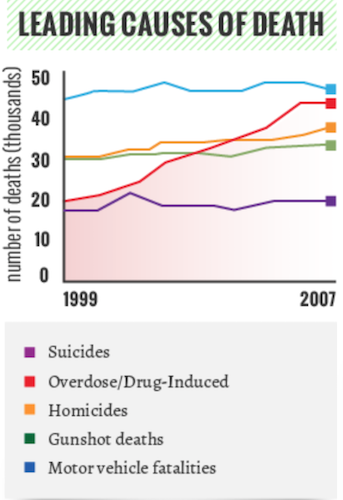
Abuse of prescription drugs can be even riskier than the abuse of illegally manufactured drugs. The high potency of some of the synthetic (man-made) drugs available as prescription drugs creates a high overdose risk. This is particularly true of OxyContin and similar painkillers, where overdose deaths more than doubled over a five-year period. of OxyContin and similar painkillers, where overdose deaths more than doubled over a five-year period.
Money Expenditures
In the past 15 years, the pharmaceutical industry has provided a host of new psychotropic drugs to clinicians treating mental disorders. Two major new classes of psychotropic drugs have been introduced, and nine new antidepressant agents and five new antipsychotic drugs have been approved by the U.S. Food and Drug Administration (FDA) since 1988.
Psychotropic drugs are playing an increasingly central role in the treatment of mental disorders. By 1996, they were used in 77 percent of mental health treatment cases (Frank and Glied, 2005 tabulations from the Medical Expenditure Panel Survey). This trend has been accompanied by unprecedented rises in spending on prescription drugs generally and psychotropic medications specifically. The amount of money spent on psychotropic drugs grew from an estimated $2.8 billion in 1987 to nearly $18 billion in 2001 (Coffey et al. 2000, Mark et al. 2005), and the amount spent on psychotropic drugs has been growing more rapidly than that spent on drugs overall (IMS Health 2005). For example, spending on antidepressant and antipsychotic medications grew 11.9 percent and 22.1 percent, respectively, in 2003, whereas spending on drugs overall grew at 11.5 percent in 2003 (IMS Health 2005).



Total Prescription Drug Expenditures and Number of Prescription Drugs Dispensed (in billions): United States 2009 to 2016
In this section, you will find a dropdown menu where you can select two options: first, the total
prescription
drug expenditures in the United States from years 2009 to 2016. And second, the total number of medical
drug prescriptions dispensed
in the United States by year from years 2009 to 2016.
The prescription drug expenditures in the United States statistic means the total amount that the U.S
funds for prescription drugs every year. In 2000, prescription drug expenditure came to some 121 billion
U.S. dollars. Until 2017,
this figure is expected to increase to over 360 billion U.S. dollars.
The the total number of medical drug prescriptions dispensed in the United States statistic shows
the total amount of prescription drugs that were medically prescribed to the U.S. population each year.
In 2016, there were approximately 4.45 billion prescriptions issued all
over the United States. This was a significant increase from 3.99 billion prescriptions dispensed
six years earlier
Data table- Drug overdose death rates, by age group: United States, 1999–2015
Pharmaceutical companies are clearly rising in profits yet the death rates of drug overdoses continue to rise. See any correlation? In this section, you will find a dropdown menu where you can select two options: first, the age group of people in the United States between 15-65+ separated into 6 age ranges and the second the years ranging from 1999-2015. This table covers Drug overdose in the United States.
| Year | Age Group | Number of Deaths |
Deaths per 1,000 |
|---|---|---|---|
| 1999 | 15–24 | 1,240 | 3.2 |
| 2000 | 15–24 | 1,435 | 3.7 |
| 2001 | 15–24 | 1,700 | 4.2 |
| 2002 | 15–24 | 2,095 | 5.1 |
| 2003 | 15–24 | 2,491 | 6.0 |
| 2004 | 15–24 | 2,751 | 6.6 |
| 2005 | 15–24 | 2,918 | 6.9 |
| 2006 | 15–24 | 3,460 | 8.1 |
| 2007 | 15–24 | 3,550 | 8.2 |
| 2008 | 15–24 | 3,487 | 8.0 |
| 2009 | 15–24 | 3,377 | 7.7 |
| 2010 | 15–24 | 3,571 | 8.2 |
| 2011 | 15–24 | 3,762 | 8.6 |
| 2012 | 15–24 | 3,518 | 8.0 |
| 2013 | 15–24 | 3,664 | 8.3 |
| 2014 | 15–24 | 3,798 | 8.6 |
| 2015 | 15–24 | 4,235 | 9.7 |
| 2007 | 25–34 | 6,663 | 8.2 |
| 2008 | 25–34 | 6,739 | 16.8 |
| 2009 | 25–34 | 7,013 | 17.2 |
| 2010 | 25–34 | 7,572 | 18.4 |
| 2011 | 25–34 | 8,445 | 20.2 |
| 2012 | 25–34 | 8,508 | 20.1 |
| 2013 | 25–34 | 8,947 | 20.9 |
| 2014 | 25–34 | 10,055 | 23.1 |
| 2015 | 25–34 | 11,880 | 26.9 |
| 2008 | 35–44 | 8,885 | 21.1 |
| 2009 | 35–44 | 8,524 | 20.5 |
| 2010 | 35–44 | 8,546 | 20.8 |
| 2011 | 35–44 | 9,130 | 22.5 |
| 2012 | 35–44 | 8,948 | 22.1 |
| 2013 | 35–44 | 9,320 | 23.0 |
| 2014 | 35–44 | 10,134 | 25.0 |
| 2015 | 35–44 | 11,505 | 28.3 |
| 2008 | 45–54 | 11,222 | 25.2 |
| 2009 | 45–54 | 11,390 | 25.4 |
| 2010 | 45–54 | 11,299 | 25.1 |
| 2011 | 45–54 | 11,933 | 26.7 |
| 2012 | 45–54 | 11,895 | 26.9 |
| 2013 | 45–54 | 12,045 | 27.5 |
| 2014 | 45–54 | 12,263 | 28.2 |
| 2015 | 45–54 | 12,974 | 30.0 |
| 2008 | 55–64 | 4,396 | 12.9 |
| 2009 | 55–64 | 4,858 | 13.7 |
| 2010 | 55–64 | 5,486 | 15.0 |
| 2011 | 55–64 | 6,060 | 15.9 |
| 2012 | 55–64 | 6,423 | 16.6 |
| 2013 | 55–64 | 7,551 | 19.2 |
| 2014 | 55–64 | 8,122 | 20.3 |
| 2015 | 55–64 | 8,901 | 21.8 |
| 2008 | 65 and over | 1,587 | 4.1 |
| 2009 | 65 and over | 1,721 | 4.3 |
| 2010 | 65 and over | 1,722 | 4.3 |
| 2011 | 65 and over | 1,892 | 4.6 |
| 2012 | 65 and over | 2,094 | 4.9 |
| 2013 | 65 and over | 2,344 | 5.2 |
| 2014 | 65 and over | 2,568 | 5.6 |
| 2015 | 65 and over | 2,760 | 5.8 |
Prescription Drug Use In The Past 30 Days Among Adults Aged 18 And Over
In this section, you will find a dropdown menu where you can select three different categories of ages from the United States population whom have used at least one prescription drug in the past 30 days: United States, years 1988 to 2014. In 2013–2014, 36.5% of adults aged 18–44, 69.6% of adults aged 45–64, and 90.8% of those aged 65 and over took a prescription drug in the past month—up from levels in 1988–1994. As prescription drug use increases, so do concerns about polypharmacy. Polypharmacy— which is commonly defned as taking fve or more drugs— increases the risk of drug interactions, adverse drug events, nonadherence, and reduced functional capacity. The more drugs are becoming available, the higher the number of usage grows. Doctors are over prescribing more and more each year.
Pharmacy and Drug Store Sales in the United States from 1992 to 2015 (in billions)
This timeline depicts pharmacy and drug store sales in the United States from 1992 to 2015. In 2015, U.S. pharmacy and drug store sales amounted to about 264.37 billion U.S. dollars. What drives these sales to such high numbers? The amount of medications being prescribed to people.
-
2000-2003
Years
$ in billions
2000 2001 2002 2003 $130.86 $141.77 $153.94 $162.52 -
2004-2007
Years
$ in billions
2004 2005 2006 2007 $169.23 $179.17 $191.02 $202.28 -
2008-2011
Years
$ in billions
2008 2009 2010 2011 $210.26 $217.26 $222.23 $231.25 -
2012-2015
Years
$ in billions
2012 2013 2014 2015 $229.95 $235.55 $250.55 $263.47 -
2015-Now
Some Facts
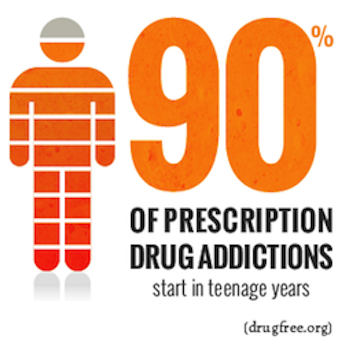
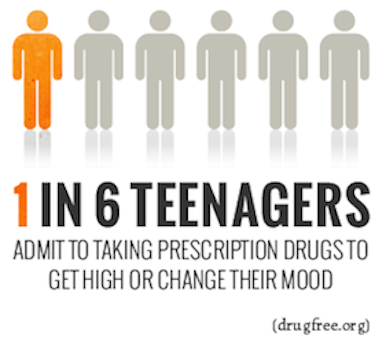
In a rapid response society, prescription medication has become the ultimate quick fix, from stressed out students cramming for exams, to ambitious professionals looking for an edge, to recovering soldiers returning from battle. And despite the death toll and the recurring headlines, the rates of prescription drug abuse and addiction continue to steadily grow.
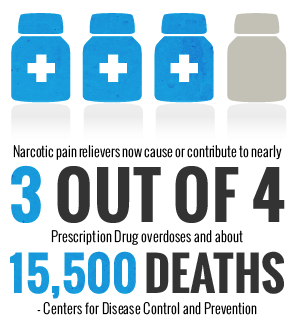
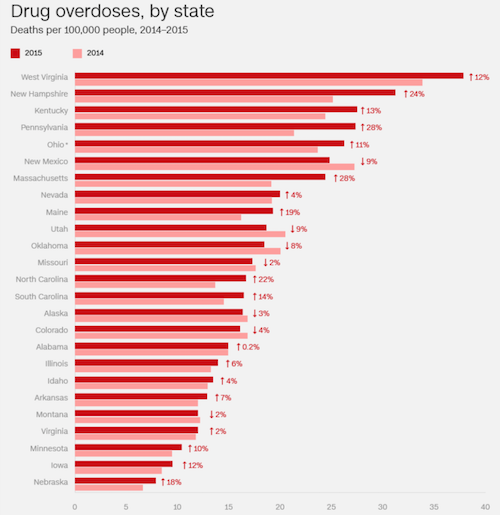
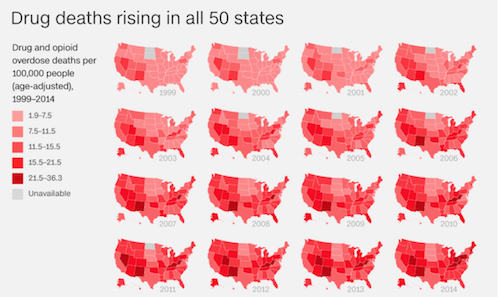
Data Brief: Drug Overdose Deaths in the United States, 1999–2015. Data table for Drug Overdose Death Rate Total and Per 1,000 People: Categorized by State.
*Click on the table headings to sort each column*
| # Rank (1 having highest number of total deaths) | State | Number of Deaths | Deaths per 1,000 |
|---|---|---|---|
| 1 | California | 4,659 | 11.3 |
| 2 | Ohio | 3,310 | 29.9 |
| 3 | Pennsylvania | 3,264 | 26.3 |
Given the uncertain future and lack of significant progress to date, it’s fair to wonder where drug
abuse is most pronounced and which areas are most at risk in the current political climate. This table
attempts to answer those questions by comparing the 50 states and the District of Columbia across key
metrics, relating
to drug overdoses.
*Click on the table headings to sort each column*
|
Overall Rank |
State |
Total Score |
‘Drug Use & Addiction’ Rank |
‘Law Enforcement’ Rank |
‘Drug Health Issues & Rehab’ Rank |
|---|---|---|---|---|---|
| 1 | District of Columbia | 64.06 | 1 | 31 | 3 |
| 2 | Vermont | 54.97 | 5 | 46 | 1 |
| 3 | Colorado | 54.58 | 2 | 30 | 15 |
| 4 | Delaware | 54.10 | 23 | 3 | 7 |
| 5 | Rhode Island | 52.75 | 3 | 50 | 6 |
| 6 | Oregon | 51.82 | 10 | 13 | 10 |
| 7 | Connecticut | 49.49 | 21 | 40 | 4 |
| 8 | Arizona | 49.35 | 12 | 22 | 12 |
| 9 | Massachusetts | 49.31 | 9 | 48 | 5 |
| 10 | Michigan | 49.18 | 6 | 15 | 30 |
| 11 | New Hampshire | 48.76 | 4 | 23 | 32 |
| 12 | West Virginia | 48.33 | 14 | 11 | 27 |
| 13 | New York | 48.19 | 33 | 39 | 2 |
| 14 | Indiana | 46.91 | 20 | 12 | 20 |
| 15 | Louisiana | 46.56 | 26 | 7 | 21 |
| 16 | Missouri | 46.50 | 34 | 4 | 18 |
| 17 | Maine | 46.47 | 7 | 21 | 37 |
| 18 | Maryland | 46.15 | 13 | 41 | 13 |
| 19 | Washington | 44.66 | 8 | 44 | 23 |
| 20 | North Carolina | 43.99 | 25 | 19 | 19 |
| 21 | New Mexico | 43.83 | 11 | 34 | 36 |
| 22 | Mississippi | 43.71 | 30 | 9 | 33 |
| 23 | California | 43.42 | 27 | 25 | 17 |
| 24 | Kentucky | 43.33 | 16 | 28 | 35 |
| 25 | Georgia | 42.87 | 35 | 20 | 16 |
| 26 | Arkansas | 42.76 | 22 | 14 | 38 |
| 27 | Ohio | 42.74 | 17 | 43 | 22 |
| 28 | Montana | 42.73 | 24 | 10 | 44 |
| 29 | Illinois | 42.71 | 32 | 6 | 42 |
| 30 | Alaska | 42.71 | 18 | 37 | 24 |
| 31 | South Carolina | 41.91 | 29 | 38 | 11 |
| 32 | Pennsylvania | 40.95 | 28 | 32 | 26 |
| 33 | Nevada | 40.18 | 19 | 47 | 28 |
| 34 | Florida | 39.11 | 31 | 17 | 47 |
| 35 | New Jersey | 38.61 | 39 | 33 | 9 |
| 36 | Oklahoma | 36.38 | 36 | 36 | 39 |
| 37 | Wyoming | 36.11 | 47 | 2 | 43 |
| 38 | South Dakota | 35.63 | 51 | 1 | 29 |
| 39 | Tennessee | 35.38 | 15 | 51 | 40 |
| 40 | Minnesota | 34.45 | 46 | 35 | 14 |
| 41 | Virginia | 33.79 | 44 | 24 | 31 |
| 42 | Alabama | 33.48 | 37 | 49 | 25 |
| 43 | Iowa | 33.33 | 50 | 27 | 8 |
| 44 | Texas | 33.32 | 41 | 18 | 46 |
| 45 | Utah | 32.78 | 45 | 26 | 34 |
| 46 | Hawaii | 32.15 | 38 | 45 | 48 |
| 47 | Wisconsin | 31.74 | 40 | 42 | 41 |
| 48 | North Dakota | 31.72 | 48 | 8 | 49 |
| 49 | Nebraska | 31.66 | 49 | 5 | 45 |
| 50 | Kansas | 30.48 | 43 | 16 | 50 |
| 51 | Idaho | 28.52 | 42 | 29 | 51 |
Contact/Resources

Danielle Molinar
danielle.r.molinar@gmail.com
Download Data
Mental health and substance use disorder expenditures: U.S, 1986–2014
The Health, United States (2016): National Trends in
Health Statistics
Credits
I do not own any of the images on this website. All rights are reserved to those who took the photos.